After several years marked by the Coronavirus health crisis on a global scale, seasonal rentals seem to be picking up again. Many data are beginning to be collected, particularly at European level. Our concierge offers you to break down this data and analyze its concrete impact for owners and tenants alike.
Essential Airbnb data in Europe for 2022:
- Booked nights are up +35,9% over one year and +0,2% compared to 2019.
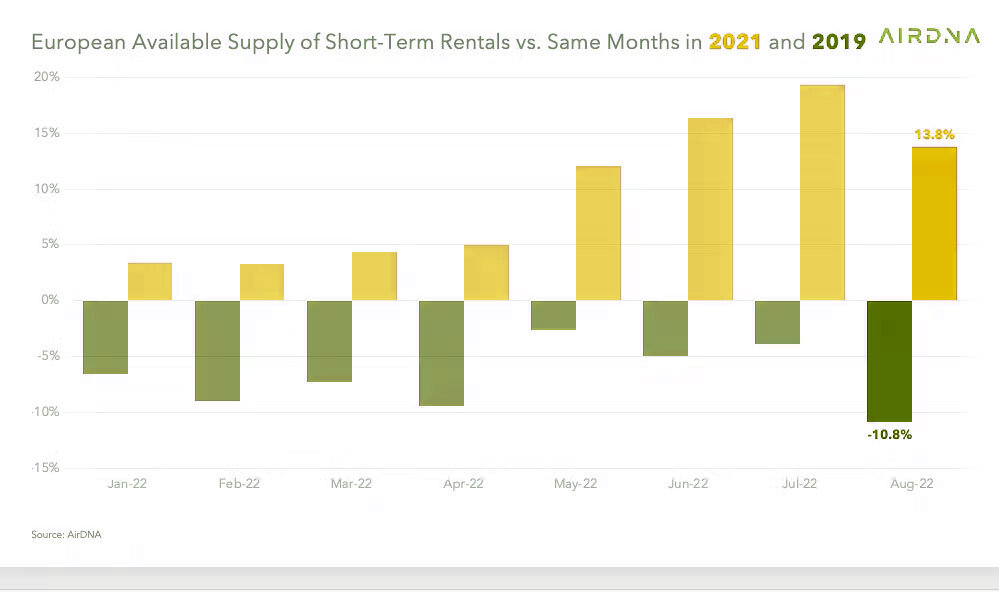
- The number of available rooms increased by 13,8% compared to 2021 and down by 10,8% compared to 2019.
- The average occupancy rate observed is 76,5%, up 4,3% compared to 2021
- Average income up by +30,1% over 1 year and by 16,7% compared to 2019
The evolution of the rental supply in 2022 compared to 2021 and 2019:

The graph opposite allows us to compare the airbnb rental offer in 2022 with 2021 and 2019 (before the covid crisis, therefore). The graphs speak for themselves, we see a sharp increase in supply over 1 year but a certain decline compared to 2019. The health crisis therefore seems to have a lasting impact on seasonal rentals, particularly from the point of view of supply. rental.
The evolution of Airbnb demand in 2022 compared to 2021 and 2019:

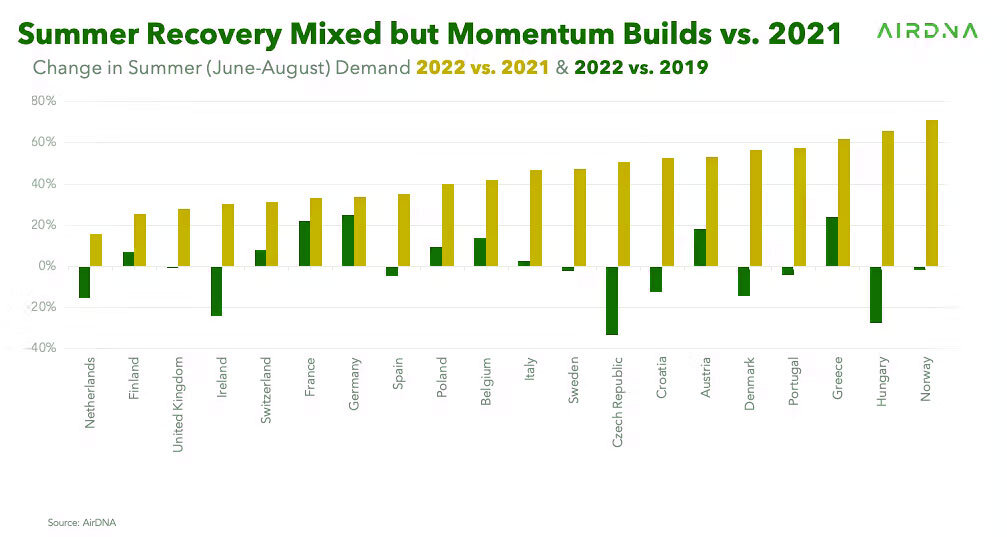
As before, we are comparing 2022 data here with 2021 and 2019. Overall, demand for 2022 is very strong compared to 2021. Depending on the country, the relationship with 2019 is positive or negative. France is doing well and is a good student with an increase of more than 20% compared to 2019 and almost 35% compared to 2021. Countries like the Czech Republic, Hungary or Ireland are suffering from a severe drop in demand over 3 years.
The evolution of the average Airbnb occupancy rate in 2022:

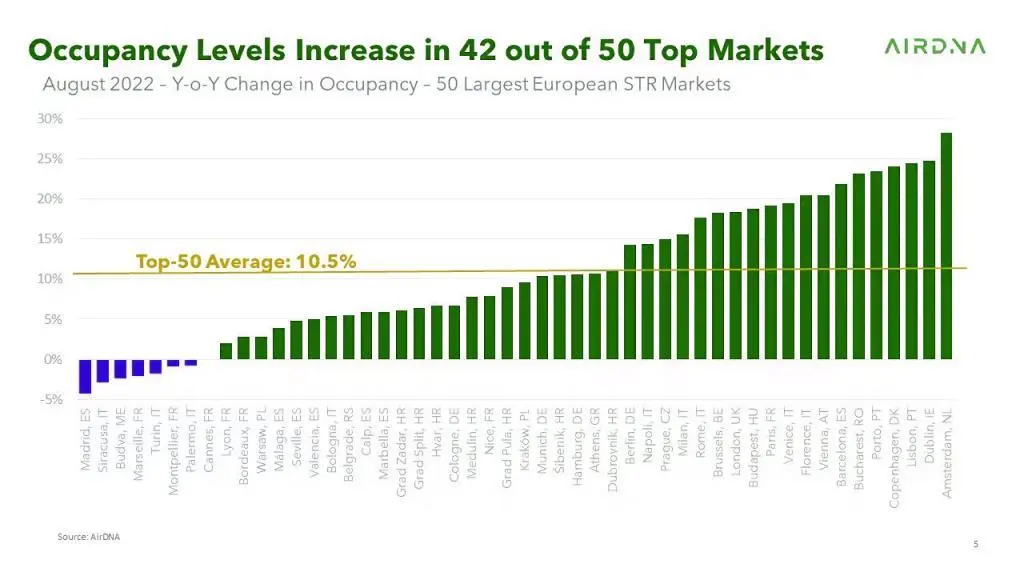
The chart below compares 1 year data only. Here we see an almost general increase in the trendiest cities in Europe. On average, the evolution of the occupancy rate over 1 year for the European top 50 is 10,5%, a very good score. We also mention the interest of the occupancy rate in the previous article: Airbnb occupancy rate: In which cities to invest?. Good news for many owners all over Europe, after two bad years for Airbnb rentals.
We leave the conclusion to Alexandra, director of our Bordeaux Concierge :
Airbnb's European market data in 2022 is very encouraging. The key for us, as concierges, is to visualize a positive progression from one year to the next. After the coronavirus crisis which made a strong impression, we see here that owners do not lose hope even if a decline persists over 3 years. We can't return to the previous level so easily, but at the moment the signals are green. The rise of nearly 20% in July and nearly 15% in August is, for example, excellent news on the confidence of investors and owners in Airbnb rentals.
Demand is also following, particularly in France. We could easily anticipate it, France being a particularly recognized destination on a global scale and attracting more and more French people themselves. We salute our colleagues from countries with darker statistics even if we are confident and hope that the situation will pick up again in the coming years. Seasonal rental and Airbnb have not said their last word in Europe and good times are emerging for the next few years.


